หน้าแรกของ IC Markets เข้าสู่ระบบ เว็บเทรดเดอร์ ติดต่อเรา
IC Markets Social IC Markets Social

Information Hub for
Serious Traders

  • เกี่ยวกับเรา
  • เปิดบัญชีเทรด
  • เปิดบัญชีเดโม่
  • เริ่มเทรด
  • เยี่ยมชมบล็อกของเรา
IC Markets Social
  • เกี่ยวกับเรา
  • เปิดบัญชีเทรด
  • เปิดบัญชีเดโม่
  • เริ่มเทรด
  • เยี่ยมชมบล็อกของเรา
August 4, 2021North_American_Stocks_enIC Markets

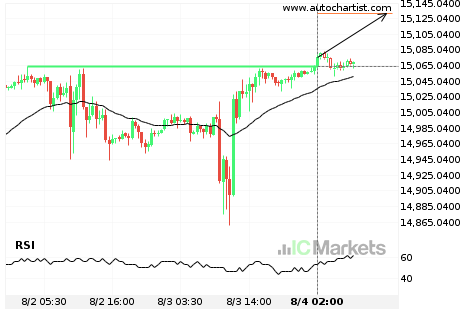
Important price line breached by US Tech 100 Index

US Tech 100 Index has broken through a line of 15064.2002 which it has tested numerous times in the past. We have seen it retrace from this position in the past, one should wait for confirmation of the breakout before trading. If this new trend persists, a target line of around 15131.5000 can be expected […]

Read more
August 3, 2021North_American_Stocks_enIC Markets

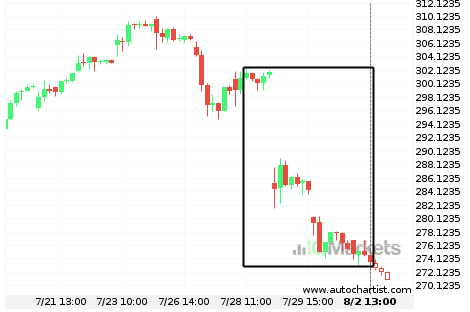
Paypal Holdings Corp is on its way down

Paypal Holdings Corp has experienced an exceptionally large movement lower by 9.32% from 300.85 to 273.54 in the last 6 days.

Read more
August 2, 2021North_American_Stocks_enIC Markets

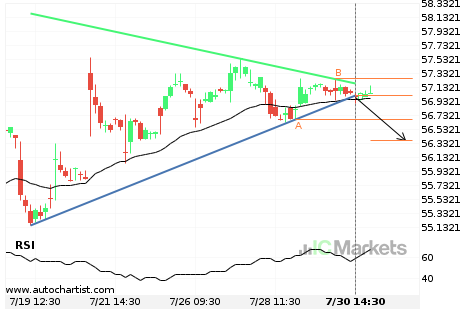
A start of a bearish trend on Coca-Cola Co.

Coca-Cola Co. has broken through a support line of a Triangle chart pattern. If this breakout holds true, we expect the price of Coca-Cola Co. to test 56.3756 within the next 19 hours. But don’t be so quick to trade, it has tested this line in the past, so you should probably confirm the breakout […]

Read more
July 30, 2021North_American_Stocks_enIC Markets

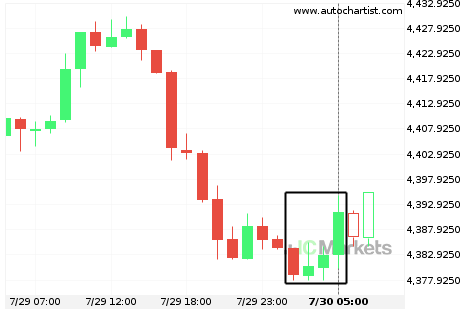
US SPX 500 Index experienced an exceptionally large movement

For those of you that don’t believe in trends, this may be an opportunity to take advantage of an exceptional 0.29% move on US SPX 500 Index. The movement has happened over the last 4 hours. For those trend followers among you, you may think about riding this trend.

Read more
July 28, 2021North_American_Stocks_enIC Markets

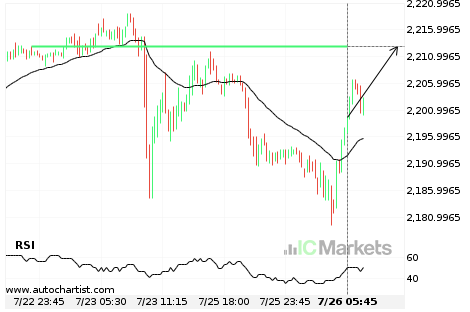
US Wall Street 30 Index – getting close to psychological price line

US Wall Street 30 Index is moving towards the support line of a Support. Because we have seen it retrace from this positions in the past, we could see either a break through this line, or a rebound back to current lines. It has touched this line numerous times in the last 2 days and […]

Read more
July 27, 2021North_American_Stocks_enIC Markets

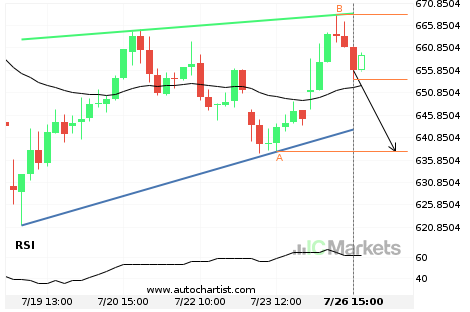
Either a rebound or a breakout imminent on Tesla Inc.

Tesla Inc. is heading towards the support line of a Rising Wedge. If this movement continues, we expect the price of Tesla Inc. to test 637.7000 within the next 11 hours. But don’t be so quick to trade, it has tested this line numerous times in the past, so this movement could be short-lived and […]

Read more
July 26, 2021North_American_Stocks_enIC Markets

US Small Cap 2000 Index – getting close to psychological price line

US Small Cap 2000 Index is moving towards the resistance line of a Resistance. Because we have seen it retrace from this positions in the past, we could see either a break through this line, or a rebound back to current lines. It has touched this line numerous times in the last 4 days and […]

Read more
July 23, 2021North_American_Stocks_enIC Markets

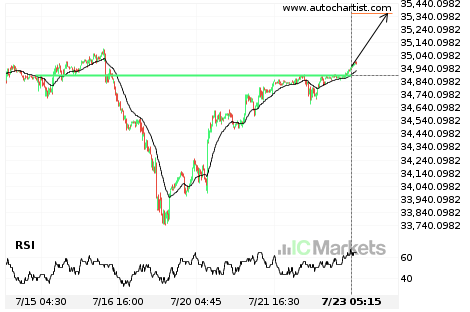
Important price line breached by US Wall Street 30 Index

US Wall Street 30 Index has broken through a line of 34889.1016 which it has tested numerous times in the past. We have seen it retrace from this position in the past, one should wait for confirmation of the breakout before trading. If this new trend persists, a target line of around 35359.1602 can be […]

Read more
July 22, 2021North_American_Stocks_enIC Markets

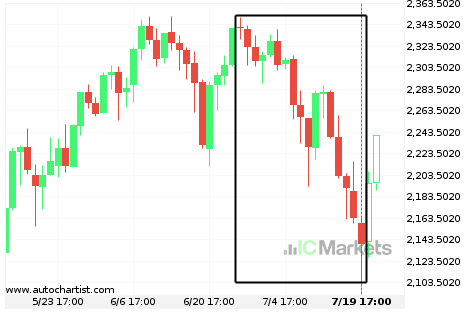
US Small Cap 2000 Index is on its way down

US Small Cap 2000 Index has experienced an exceptionally large movement lower by 8.54% from 2,339.5 to 2,139.52 in the last 26 days.

Read more
July 21, 2021North_American_Stocks_enIC Markets

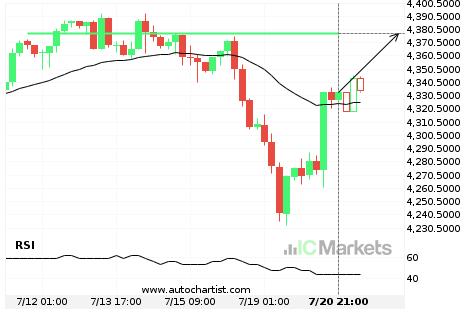
US SPX 500 Index approaching important 4377.7002 price line

US SPX 500 Index is approaching the resistance line of a Resistance. It has touched this line numerous times in the last 10 days. If it tests this line again, it should do so in the next 2 days.

Read more
  • 1
  • 2
  • 3
  • …
  • 31
  • 32
  • 33
  • 34
  • 35
  • 36
  • 37
  • …
  • 45
  • 46
  • 47

Recent Posts

  • Either a rebound or a breakout imminent on SILVER
  • GOLD Nível visado: 2976.3601
  • A potential bearish movement on GOLD
  • มีโอกาสเกิดการเคลื่อนตัวแบบ bearish บน GOLD
  • Posible gran movimiento en el AUDJPY

Recent Comments

    Translation


     Edit Translation

    เปิดบัญชีและฝากเงินได้แบบทันที

    เทรดได้ภายในไม่กี่นาที!

    เริ่มต้น ลองบัญชีเดโมได้ฟรี

    การเทรดฟอเร็กซ์

    • ภาพรวมของบัญชี
    • เปิดบัญชี
    • ใช้งาน Web Trader

    รายละเอียดของการซื้อขาย

    • สเปรดและค่าคอมมิชชั่น
    • ขอบเขตของตลาด
    • ช่วงเวลาซื้อขาย
    • การเพิ่มเงิน
    • การถอนเงิน

    เกี่ยวกับ IC Markets

    • Help Centre
    • ทำไมถึงต้องเป็น IC Markets
    • กฎระเบียบ
    • เอกสารทางกฎหมาย
    • ติดต่อเรา


    Forex Trading

    • Accounts Overview
    • Open an Account
    • Launch Web Trader

    Trading Specifications

    • Spreads and Commissions
    • Range of Market
    • Trading Hours
    • Funding
    • Withdrawal

    About IC Markets

    • Chat with a Specialist 24/7
    • Why IC Markets
    • Regulation
    • Legal Documents
    • ติดต่อเรา

    ข้อความจำกัดความรับผิดชอบ: เนื้อหาข้อมูลนี้เป็นเนื้อหาด้านการตลาดซึ่งได้ถูกเผยแพร่เพื่อวัตถุประสงค์ในการให้ข้อมูลเท่านั้น เนื้อหานี้ไม่ได้ประกอบไปด้วยและไม่ควรถือว่าประกอบไปด้วยคำแนะนำหรือการเสนอแนะด้านการลงทุน หรือการแนะนำให้มีการดำเนินการใดๆ กับตราสารทางการเงิน วิดเจ็ตที่แสดงอยู่ภายในเป็นของผู้จัดทำจากภายนอกและ IC Markets ไม่มีส่วนรับผิดชอบใดๆ เกี่ยวกับเนื้อหาและผลกระทบที่มีต่อการเทรด

    สงวนลิขสิทธิ์สำหรับเนื้อหาทั้งหมด ความคิดเห็นของผู้จัดทำอาจไม่สอดคล้องกับความคิดเห็นของผู้จัดทำบล็อก เมื่อมีการคัดลอกเนื้อหาจากเว็บไซต์นี้หรือมีการเชื่อมโยงไปยังฟีด RSS เพื่อเผยแพร่บทความของเรา ผู้ที่ทำการคัดลอกจะต้องใส่ลิงก์ไปยัง IC Markets หรือมีการระบุแหล่งที่มาในรูปแบบ ‘IC Markets Blog’ สำหรับคำถามโดยทั่วไปโปรดติดต่อสำนักงานบรรณาธิการผ่านทางแบบฟอร์มบนหน้าติดต่อเรา

    คำเตือนเกี่ยวกับความเสี่ยง: การเทรดตราสารอนุพันธ์มีความเสี่ยงในระดับสูงกับเงินทุนของคุณและคุณควรทำการเทรดด้วยเงินที่คุณ สามารถรับการขาดทุนได้เท่านั้น การเทรดตราสารอนุพันธ์อาจไม่เหมาะกับนักลงทุนทุกท่าน ดังนั้นโปรดทำความเข้าใจกับความเสี่ยงที่เกี่ยวข้องและหาคำแนะนำที่เป็นอิสระหากจำเป็น นักลงทุนควรศึกษา Product Disclosure Statement (PDS) ก่อนทำธุรกรรมใดๆ กับเรา

    เนื้อหาข้อมูลที่ถูกแสดงอยู่บนหน้านี้เป็นข้อมูลโดยทั่วไปเท่านั้นและไม่ได้มีการคำนึงถึงสถานการณ์ส่วน ตัวของคุณ, เป้าหมายทางการเงิน หรือความต้องการของคุณ คุณเป็นผู้พิจารณาว่าผลิตภัณฑ์ต่างๆ ที่เรามีให้บริการเหล่านี้ตรงกับความต้องการของคุณหรือไม่ อีกทั้งคุณไม่ควรทำการเทรดกับเราจนกว่าคุณจะเข้าใจถึงคุณสมบัติและความเสี่ยงที่เกี่ยวข้องกับผลิตภั ณฑ์ที่เรามีให้บริการ นั่นหมายความว่าคุณอาจต้องการคำแนะนำที่เป็นอิสระก่อนที่คุณจะเริ่มต้นเทรดกับเรา

    © 2022 Raw Trading Ltd | All rights reserved.
    • Sample Page